Impact Numbers
We work closely with our borrowers to help them make a meaningful impact in disadvantaged communities. See our impact numbers across five categories:
We work closely with our borrowers to help them make a meaningful impact in disadvantaged communities. See our impact numbers across five categories:


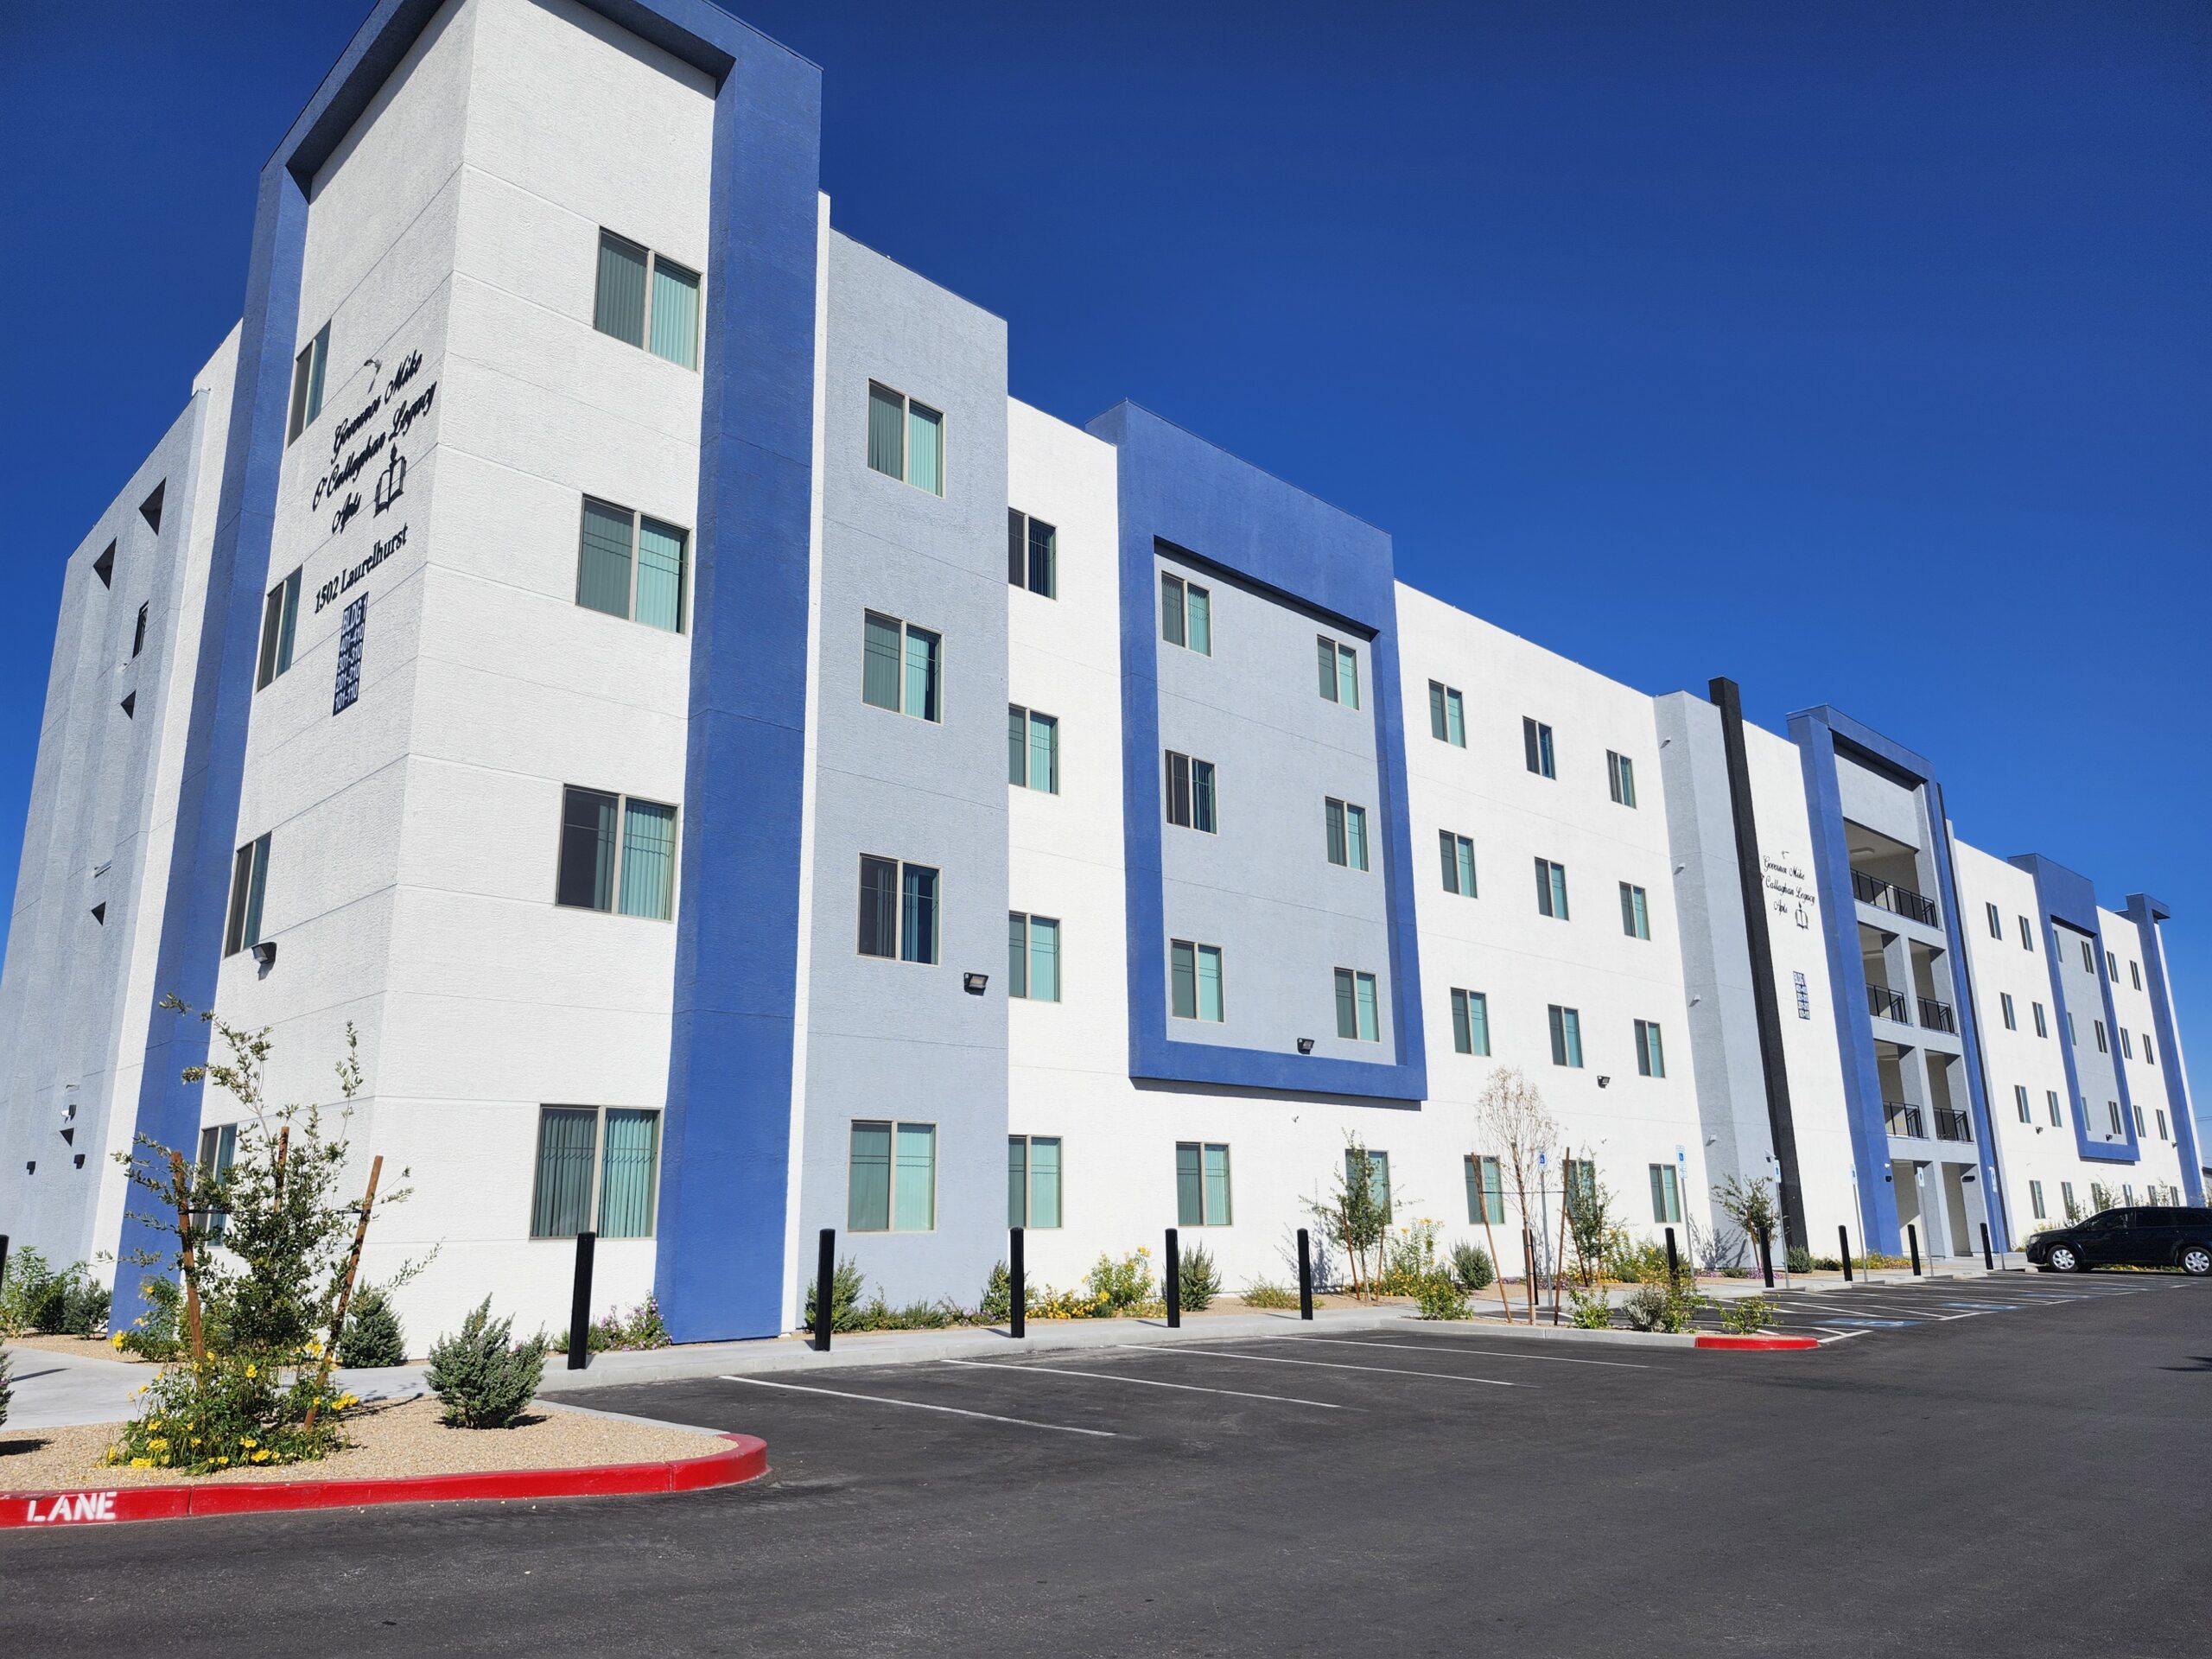
Clearinghouse CDFI provided $1,780,000 in financing to 1501 LLC to refinance an existing construction loan for the Governor Mike O’Callaghan Apartments. Read more »


Clearinghouse CDFI provided $937,500 in acquisition financing to Overcomers Ministries Church in Richardson, Texas, to support the purchase of a permanent headquarters. Read more »


Clearinghouse CDFI provided $8,037,500 in financing to Danbury Real Estate LLC to support the acquisition of a three-story, 100-room limited-service hotel in Bethlehem, Pennsylvania. Read more »


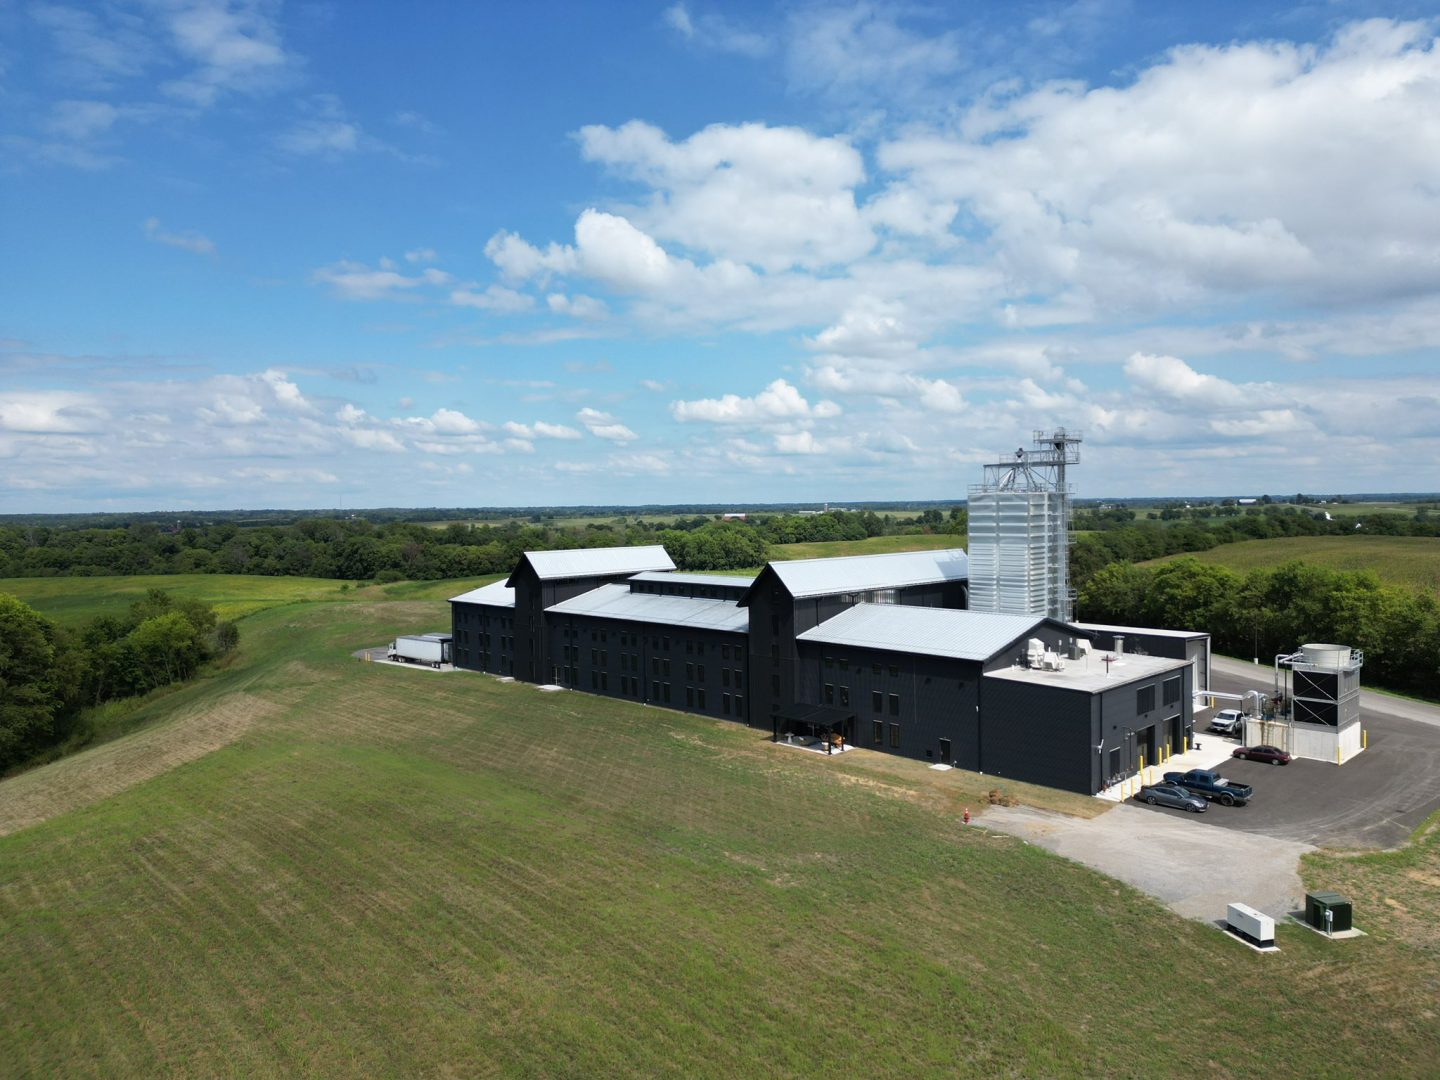
Clearinghouse CDFI provided $1,500,000 in financing to J&D Distilling Co., LLC, to refinance an existing trust loan and provide working capital to support continued operations. Read more »


Clearinghouse CDFI provided $6,000,000 of New Markets Tax Credit allocation to Sun Life Family Health Center to finance the construction of a state-of-the-art healthcare facility in Casa Grande, Arizona. Read more »


Clearinghouse CDFI financed a new storage facility in Lake Wales, supporting local growth and expanding essential infrastructure. Read more »